## Internship @Cinet 2017/11-2018/03
Development of software for visual stimulus presentation and eye movement measurement used in brain imaging experiments and psychophysical experiments (mainly using C ++, OpenGL, and MATLAB). Support for experiment execution. Behavioral experiment collected by experiment and development of software for analyzing brain activity measurement data (mainly using MATLAB) and analysis and related work.
インターンシップ@Cinet 2017/11-2018/03
MRI実験においては、被験者が指示にちゃんと従っていないこともあると考えるから、Eyelink 1000cを使い、被験者が指示に従っていることを検証する。
MATLABプログラムを作り、四パターン(ドットが動く・動かない、文字が動く・動かない)の場合の被験者の眼球運動を記録する。
その後、取ったデータを処理し、四パターンの眼球運動状況を調べる。
そこで、なんとなく、眼球運動状況を調べることによって、被験者が指示に従っていることが分かるようになった。
11.10
当面実施してもらう課題
- Psych toolboxを用いたコーディング
* 刺激表示
* アニメーション
* ステレオ3D表示
* ターゲット刺激作成
* 実験タイムコース実装
* テキスト表示
* ボタン応答取得
* 固視タスク刺激作成
ポーティンぐ基となるプログラム
OpenGLステレオ3Dプログラム
11.17
- 円を描く ``` window=Screen(‘OpenWindow’,0,0);%全画面ウィンドウ作成%画面は黒 Screen(‘FillOval’,window,255,[0,0,200,200]);%円を描画 Screen(‘Flip’,window);%描画内容を表示 GetClicks;%クリックを待つ Screen(‘CloseAll’);%全画面表示終了
解釈 window=Screen(‘OpenWindow’,0,0); %screen(subcommand,main monitor,色) Screen(‘FillOval’,window,255,[0,0,200,200]); %window=前のOpenWindowの戻り値,255=色は白,[0,0,200,200]=ウィンドウ左上からの位置とサイズ
- 円を移動する
window=Screen(‘OpenWindow’,0,0); for i = 1 : 100 Screen(‘FillOval’,window,255,[i,i,i+200,i+200]); Screen(‘Flip’,window); end Screen(‘CloseAll’);
- draw a black filled rectangle (10x25) in it by saying: Screen(window,'FillRect',BlackIndex(window),[0,0,25,10]). You can erase the whole window by overwriting with white: Screen(window,'FillRect').
- display a grating (http://cda.psych.uiuc.edu/matlab_class/Psychtoolbox%20-%20Tutorial.htm)
%full screenを開ける
whichScreen=0; %main monitor
window=Screen(whichScreen,’OpenWindow’);
%色を決める
white=WhiteIndex(window); % pixel value for white
black=BlackIndex(window); % pixel value for black
gray=(white+black)/2;
inc=white-gray;
Screen(window,’FillRect’,gray);
%compute a gabor patch
[x,y]=meshgrid(-100:100,-100:100);
m=exp(-((x/50).^2)-((y/50).^2)).sin(0.032pix);
Screen(window,’PutImage’,gray+inc*m);
%ボタン
GetChar;
Screen(window,’Close’);
- experiment.cppを読む

## 11.30
- モニタのキャリブレーション(多分使わないと思う)
CalibrateMonitorPhotometer .m CalibrateMonSpd.m ColorCalなど複数の輝度計をサポート 要Curve fi}ng toolbox
- 図形の中央に文字列を描画(window+文字列設定+ 描画 )
%画面の中央に円と文字列を描画する function TextPosCheck ListenChar(2); AssertOpenGL; KbName(‘UnifyKeyNames’); %myKeyCheck;
try
screenNumber=max(Screen('Screens'));
%ウィンドウでの呈示
%[windowPtr, windowRect]=Screen('OpenWindow', screenNumber, [0 0 0], [100, 200, 700, 600]);
%フルスクリーンでの呈示
[windowPtr, windowRect]=Screen('OpenWindow', screenNumber, [0 0 0]);
%説明: %[windowPtr,rect]=Screen('OpenWindow',windowPtrOrScreenNumber [,color] [,rect][,pixelSize][,numberOfBuffers][,stereomode][,multisample][,imagingmode]);
%オンスクリーンウィンドウ*を開きます。ウィンドウを指定するために、windowPtr または screenNumber(0だとメニューバーが表示されるメインのスクリーンを表します)を使います。 %”color” はclut index でスカラー(単一の数字)またはRGB値で指定されます。”color”はそれぞれのピクセルに割り当てられ、デフォルト(colorの指定をしない場合)は白になります。
% *これに対して、ディスプレイ上に表示されないオフスクリーンウィンドウがあります。
%”rect” は少なくとも1つのピクセルを含んでいなければいけません。 %”windowPtr ”が指定された場合は、rectはウィンドウ座標(左上が原点)になり、デフォルトではウィンドウ全体を表します。 %”screenNumber”が指定された場合は、rectはスクリーン座標(左上が原点)になり、デフォルトではスクリーン全体を表します。 %”rect”引数が与えられた場合(フルスクリーン表示でない場合)は、デバッグ(プログラムの修正作業)には便利ですが、描画パフォーマンス、刺激の呈示%タイミングの精度が落ちてしまうので注意しなければいけません。
%”pixelSize”はビット深度(色深度、カラー深度)を表します。
%”numberOfBuffers”はバッファの数です。2よりも大きい値(2を含む?)を指定すると、PTBの開発またはデバッグのときに便利ですが、実際の実験には%不適切です。
%”stereomode”は立体視のようにふたつの刺激を呈示するときに使用します。 %”stereomode”が0のときは、両眼分離呈示は行いません。 %”stereomode”が1のときは、CrystalViewのシャッターメガネのように、MacOS-XでサポートされているハードウェアをOpenGLを使って制御する場合で%す。 %”stereomode”が2のときは、ディスプレイが上下に分割され、上側に左眼用の刺激が、下側に右眼用の刺激が呈示されます。
%画面の中央の座標
[centerX centerY] = RectCenter(windowRect);


%赤い円の描画
Radius = 30; %円の半径
tmpRect = [centerX - Radius, centerY - Radius, centerX + Radius, centerY + Radius]
  Screen('FrameOval', windowPtr, [255 0 0], tmpRect);   %説明:指定した長方形に内接するように円が描画されます。   %互いに重複なくランダムドットを生成するとき、外接円を考えなければならない。


%描画する文字列
Screen('TextFont',windowPtr, 'Courier New'); % フォントの種類によっては中央に描画できないことがあります。
Screen('TextSize',windowPtr, 30);
teststr = 'ab';

%スクリーン上で文字列が占める長方形領域が normBoundsRect
%事前にフォントの設定を済ませておくこと。
[normBoundsRect, offsetBoundsRect]= Screen('TextBounds', windowPtr, teststr);

%動作確認のためにnormBoundsRectを緑で描画してみましょう。
tmpRect = CenterRectOnPoint(normBoundsRect, centerX, centerY);
Screen('FrameRect', windowPtr, [0 255 0], tmpRect);

%文字列の描画(赤い円と緑の四角の中央に描画されるでしょうか)
startX = centerX - normBoundsRect(RectRight)/2;
startY = centerY - normBoundsRect(RectBottom)/2;
DrawFormattedText(windowPtr, teststr, startX, startY, [255 255 255]);


Screen('Flip', windowPtr);


KbWait;

%終了処理
Screen('CloseAll');
ShowCursor;
ListenChar(0);
catch
%終了処理
Screen(‘CloseAll’);
ShowCursor;
ListenChar(0);
psychrethrow(psychlasterror);
end;
-ランダムに円心を生成(grid数の設定,randperm関数,密度により数の計算)
ランダムに刺激を生成する配列(例 for文) %水平方向のグリッドの数 HorizGridNum=10; %垂直方向のグリッドの数 VertGridNum=10;
a=[1:HorizGridNum]; b=[1:VertGridNum]; [x,y]=meshgrid(a,b);
order=randperm(HorizGridNumVertGridNum); % 1 から HorizGridNumVertGridNum までの整数のランダム置換を含む行ベクトルを返します for cnt = 1:30 %30個、生成 index = order(cnt); if index ~= 13 %凝視点部分(グリッドの13番目)は描画しない %描画する画像の左上のX座標 tmpX = (x(index)-1) * GridWidth + centerX - (GridWidth * HorizGridNum)/2 + (GridWidth - Tx)/2; %描画する画像の左上のY座標 tmpY = (y(index)-1) * GridHeight + centerY - (GridHeight * VertGridNum)/2 + (GridHeight - Ty)/2;
  if index == 7 %グリッドの7番目に"L"を呈示する
    Screen('DrawTexture', win, Limagetex, [], [tmpX tmpY tmpX+Lx tmpY+Ly], rand(1)*360);
  else
    Screen('DrawTexture', win, Timagetex, [], [tmpX tmpY tmpX+Tx tmpY+Ty], rand(1)*360);
  end;
end;     end; ```
- 非表示領域を考えた円心配列(試作) ``` %水平方向のグリッドの数 HorizGridNum=10; %垂直方向のグリッドの数 VertGridNum=10; %非表示領域半径 radius=5 %生成する円心の数 num= 3 a=[1:HorizGridNum]; b=[1:VertGridNum]; %[x,y]=meshgrid(a,b);
% 1から HorizGridNum* VertGridNum の整数ベクトルを生成、1からnum 番のところで円を描く予定です。しかし、円心が非表示領域の中に存在するなら、 ベクトルを作り直す。 n=num; while n ~= 0 n=num;
order=randperm(HorizGridNum*VertGridNum); for k = 1 : num
i = mod(find(order == k), VertGridNum); % k番の座標を計算 j = (find( order == k) - i ) / VertGridNum ; if i == 0 i = VertGridNum; end if i^2+j^2 > radius^2 n = n-1; end end end
## 12.07
Information for the first group:
[group1]
[global] http-proxy-host = proxy.nict.go.jp http-proxy-port = 3128
ip 133.243.18.8
1.円を描く—-確認完了
- 円を移動する —-確認完了
- 図形の中央に文字列を描画—- 確認完了 %画面の中央に円と文字列を描画する function play ListenChar(2); AssertOpenGL; KbName(‘UnifyKeyNames’); %myKeyCheck;
try
screenNumber=max(Screen(‘Screens’)); %ウィンドウでの呈示 %[windowPtr, windowRect]=Screen(‘OpenWindow’, screenNumber, [0 0 0], [100, 200, 700, 600]); %フルスクリーンでの呈示 [windowPtr, windowRect]=Screen(‘OpenWindow’, screenNumber, [0 0 0]);
%画面の中央の座標 [centerX, centerY] = RectCenter(windowRect);
%赤い円の描画 Radius = 30; %円の半径 tmpRect = [centerX - Radius, centerY - Radius, centerX + Radius, centerY + Radius]; Screen(‘FrameOval’, windowPtr, [255 0 0], tmpRect);
%描画する文字列 Screen(‘TextFont’,windowPtr, ‘Courier New’); % フォントの種類によっては中央に描画できないことがあります。 Screen(‘TextSize’,windowPtr, 30); teststr = ‘ab’;
%スクリーン上で文字列が占める長方形領域が normBoundsRect %事前にフォントの設定を済ませておくこと。 [normBoundsRect, ~]= Screen(‘TextBounds’, windowPtr, teststr);
%動作確認のためにnormBoundsRectを緑で描画してみましょう。 tmpRect = CenterRectOnPoint(normBoundsRect, centerX, centerY); Screen(‘FrameRect’, windowPtr, [0 255 0], tmpRect);
%文字列の描画(赤い円と緑の四角の中央に描画されるでしょうか)
%startX = centerX - normBoundsRect(RectRight)/2; %startY = centerY + normBoundsRect(RectBottom)/2; %DrawFormattedText(windowPtr, teststr, startX, startY, [255 255 255]); DrawFormattedText(windowPtr, teststr, ‘center’, ‘center’, [255 255 255]);
Screen(‘Flip’, windowPtr);
KbWait;
%終了処理 dur=5; WaitSecs(dur) Screen(‘CloseAll’); ShowCursor; ListenChar(0);
catch %終了処理 Screen(‘CloseAll’); ShowCursor; ListenChar(0); psychrethrow(psychlasterror); end
- ランダムに円心を生成—-確認完了(ランダムにサイズを生成、重複あり)
function play clear all clc try AssertOpenGL; ListenChar(2); %Matlabに対するキー入力を無効 %myKeyCheck;
screenNumber = max(Screen(‘Screens’)); %[win, rect] = Screen(‘OpenWindow’, screenNumber, [0 0 0], [10 50 750 550]); [win, rect]=Screen(‘OpenWindow’, screenNumber, [0 0 0]); %画面の中心座標 [centerX,centerY] = RectCenter(rect);
%水平方向のグリッドの数 HorizGridNum=100; %垂直方向のグリッドの数 VertGridNum=100;
a=[1:HorizGridNum]; b=[1:VertGridNum]; [x,y]=meshgrid(a,b);
GridWidth =rect(:,3)/ HorizGridNum ; GridHeight = rect(:,4)/ VertGridNum;
order=randperm(HorizGridNum*VertGridNum);
for cnt = 1:100 %100個、生成 index = order(cnt); %cnt個目のデータを抽出
%描画する画像のX座標 %tmpX = (x(index)-1) * GridWidth + centerX - (GridWidth * HorizGridNum)/2 + GridWidth/2; tmpX = (x(index)-1) * GridWidth + GridWidth/2; %描画する画像のY座標 %tmpY = (y(index)-1) * GridHeight + centerY - (GridHeight * VertGridNum)/2 + GridHeight/2; tmpY = (y(index)-1) * GridHeight + GridHeight/2;
%Radius = 30; Radius = rand * sqrt(GridHeight^2+GridWidth^2); tmpRect = [tmpX - Radius, tmpY - Radius, tmpX + Radius, tmpY + Radius]; Screen(‘FrameOval’, win, [255 0 0], tmpRect);
end
Screen(‘Flip’, win);
KbWait;
%GetClicks; %Screen(‘CloseAll’); dur=5; WaitSecs(dur) Screen(‘CloseAll’); ShowCursor; ListenChar(0); catch sca; ListenChar(0); psychrethrow(psychlasterror); end
- 非表示領域を考えた円心配列—-確認完了(円の数が増やすと、スピードが落とす)
function play clear all clc try AssertOpenGL; ListenChar(2); %Matlabに対するキー入力を無効 %myKeyCheck;
screenNumber = max(Screen(‘Screens’)); %[win, rect] = Screen(‘OpenWindow’, screenNumber, [0 0 0], [10 50 750 550]); [win, rect]=Screen(‘OpenWindow’, screenNumber, [0 0 0]); %画面の中心座標 [centerX,centerY] = RectCenter(rect);
%描画する文字列 Screen(‘TextFont’,win, ‘Courier New’); % フォントの種類によっては中央に描画できないことがあります。 Screen(‘TextSize’,win, 100); teststr = ‘a’; DrawFormattedText(win, teststr, ‘center’, ‘center’, [255 255 255]);
%水平方向のグリッドの数 HorizGridNum=100; %垂直方向のグリッドの数 VertGridNum=100; %非表示領域半径 radius=500; %生成する円心の数 num= 10 ; a=[1:HorizGridNum]; b=[1:VertGridNum]; [x,y]=meshgrid(a,b); GridWidth =rect(:,3)/ HorizGridNum ; GridHeight = rect(:,4)/ VertGridNum;
%非表示領域の境界を描く tmpRect = [centerX - radius, centerY - radius, centerX + radius, centerY + radius]; Screen(‘FrameOval’, win, [255 255 255], tmpRect);
% 1から HorizGridNum* VertGridNum の整数ベクトルを生成、1からnum 番のところで円を描く予定です。しかし、円心が非表示領域の中に存在するなら、 ベクトルを作り直す。 n=num; while n ~= 0 n=num; order=randperm(HorizGridNum*VertGridNum); for cnt = 1:num %num個、生成 index = order(cnt); %cnt個目のデータを抽出 %描画する画像のX座標 tmpX = (x(index)-1) * GridWidth + GridWidth/2; %描画する画像のY座標 tmpY = (y(index)-1) * GridHeight + GridHeight/2; if (tmpX-centerX)^2 + (tmpY-centerY)^2 > radius^2 n=n-1; end end
end
for cnt = 1:num %num個、生成 index = order(cnt); %cnt個目のデータを抽出
%描画する画像のX座標 %tmpX = (x(index)-1) * GridWidth + centerX - (GridWidth * HorizGridNum)/2 + GridWidth/2; tmpX = (x(index)-1) * GridWidth + GridWidth/2; %描画する画像のY座標 %tmpY = (y(index)-1) * GridHeight + centerY - (GridHeight * VertGridNum)/2 + GridHeight/2; tmpY = (y(index)-1) * GridHeight + GridHeight/2;
Radius = 30; tmpRect = [tmpX - Radius, tmpY - Radius, tmpX + Radius, tmpY + Radius]; Screen(‘FrameOval’, win, [255 0 0], tmpRect);
end
Screen(‘Flip’, win);
KbWait;
%GetClicks; %Screen(‘CloseAll’); dur=5; WaitSecs(dur) Screen(‘CloseAll’); ShowCursor; ListenChar(0);
catch sca; ListenChar(0); psychrethrow(psychlasterror); end
6.文字の移動—-確認完了(動きルールはまだ)
function play clear all clc try AssertOpenGL; ListenChar(2); %Matlabに対するキー入力を無効 %myKeyCheck;
screenNumber = max(Screen(‘Screens’)); %[win, rect] = Screen(‘OpenWindow’, screenNumber, [0 0 0], [10 50 750 550]); [win, rect]=Screen(‘OpenWindow’, screenNumber, [122 122 122]); %画面の中心座標 [centerX,centerY] = RectCenter(rect);
%描画する文字列 Screen(‘TextFont’,win, ‘Courier New’); % フォントの種類によっては中央に描画できないことがあります。 Screen(‘TextSize’,win, 100); teststr = ‘a’; %DrawFormattedText(win, teststr, centerX+500, ‘center’, [255 255 255]); for i = 1 : 300 DrawFormattedText(win, teststr, centerX+i, ‘center’, [255 255 255]); Screen(‘Flip’,win); end
%水平方向のグリッドの数 HorizGridNum=100; %垂直方向のグリッドの数 VertGridNum=100; %非表示領域半径 radius=500; %生成する円心の数 num= 10 ; a=[1:HorizGridNum]; b=[1:VertGridNum]; [x,y]=meshgrid(a,b); GridWidth =rect(:,3)/ HorizGridNum ; GridHeight = rect(:,4)/ VertGridNum;
%非表示領域の境界を描く tmpRect = [centerX - radius, centerY - radius, centerX + radius, centerY + radius]; Screen(‘FrameOval’, win, [255 255 255], tmpRect);
% 1から HorizGridNum* VertGridNum の整数ベクトルを生成、1からnum 番のところで円を描く予定です。しかし、円心が非表示領域の中に存在するなら、 ベクトルを作り直す。 n=num; while n ~= 0 n=num; order=randperm(HorizGridNum*VertGridNum); for cnt = 1:num %num個、生成 index = order(cnt); %cnt個目のデータを抽出 %描画する画像のX座標 tmpX = (x(index)-1) * GridWidth + GridWidth/2; %描画する画像のY座標 tmpY = (y(index)-1) * GridHeight + GridHeight/2; if (tmpX-centerX)^2 + (tmpY-centerY)^2 > radius^2 n=n-1; end end
end
for cnt = 1:num %num個、生成 index = order(cnt); %cnt個目のデータを抽出
%描画する画像のX座標 %tmpX = (x(index)-1) * GridWidth + centerX - (GridWidth * HorizGridNum)/2 + GridWidth/2; tmpX = (x(index)-1) * GridWidth + GridWidth/2; %描画する画像のY座標 %tmpY = (y(index)-1) * GridHeight + centerY - (GridHeight * VertGridNum)/2 + GridHeight/2; tmpY = (y(index)-1) * GridHeight + GridHeight/2;
Radius = 30; tmpRect = [tmpX - Radius, tmpY - Radius, tmpX + Radius, tmpY + Radius]; Screen(‘FrameOval’, win, [255 0 0], tmpRect);
end
Screen(‘Flip’, win);
KbWait;
%GetClicks; %Screen(‘CloseAll’); dur=5; WaitSecs(dur) Screen(‘CloseAll’); ShowCursor; ListenChar(0);
catch sca; ListenChar(0); psychrethrow(psychlasterror); end
## 01/25
eyelinkexampleの使い方—-calibrationを行ってからvalidationを行う (10points) Data file ‘demo.edf’ can be found in ‘C:\MyToolboxes\Psychtoolbox\PsychHardware\EyelinkToolbox\EyelinkDemos\EyelinkShortDemos’ edfファイル edf fileの導入—-できました C:\MyToolboxes\edf-converter-masterに You are allowed to use this software for free, but please acknowledge if you are using this software to process Edf-files: The conversion of the EyeLink® 1000 Edf files was done with the Edf2Mat Matlab Toolbox designed and developed by Adrian Etter and Marc Biedermann at the University of Zurich. Trackというソフトウェア start recording を押してから記録する edf fileのdownload—-確認完了
## 02/02
時刻標記に関するプログラムを考察 新しい試験では、end timeの標記はない。なお、開始時刻はsynctimeが標記する時刻ではなく、’!MODE RECORD CR 250 2 1 LR’の時刻(これがおそらくstart recordingの時刻だと思う)に近い 終了標記がないということは標記eventがないためだと思う—-違う ‘!MODE RECORD CR 250 2 1 LR ‘は開始時刻を標記する—-確認完了 パターン読み取り—-完了
## 02/15
各パターンのデータのチェックーーーー完了 calibrationについて Calibration is used to collect fixation samples from known target points in order to map raw eye data to either gaze position or HREF data. Targets are serially presented by the Display PC. The participant fixates each while samples are collected and feedback graphics are presented on the Host PC display. The calibration is automatically checked when finished, and diagnostics are provided. Calibration should be performed after Camera Setup and before Validation. Validation provides the experimenter with information about calibration accuracy. データについて The data contents of an EDF file are organized in two streams: samples and events. Samples are used to record instantaneous eye position data, while events are used to record important occurrences, either from the experimental application or from changes in the eye data. Pupil position dataーーーー raw (x, y)
HREF (head-referenced) position dataーーーー measures eye rotation angles relative to the head. It does not take into account changes in subject head position and angle, or distance from the display. However, it may be more accurate for neuro-psychophysical research, as it reflects real eye movement velocities and amplitudes.
Gaze position data reports the actual (x, y) coordinates of the subject’s gaze on the display, compensating for distance from the display. The units are in actual display coordinates (usually pixels) which can be set in the EyeLink 1000 configuration file PHYSICAL.INI. The default EyeLink coordinates are those of a 1024 by 768 VGA display, with (0, 0) at the top left.
corresponding resolution data—-r(x,y)
gx=posX gy=posY (pixels) 資料:http://sr-research.jp/support/EyeLink%201000%20User%20Manual%201.5.0.pdf P95
## 02/23
分かったこと データによる座標範囲 x~(0,2560) y~(0,1440) モニタの座標範囲 x~(0,2560) y~(0,1440) モニタ解像度 2560*1440 ウィンクが原因でx、y座標両方も変化するが、x座標の変化が小さい、y座標の変化が大きい %%%%%%%%%%%%%%%%%%%%%%%%%% NaNデータを補完した filloutliers(x1,’linear’,’quartiles’)で外れ値の検出と置き換えーーーー完了
## 03/01
measurement.mの説明
refresh rate=120Hz sampling rate=250Hz 1試行192s 16パターン 1パターン12s %距離=dis/1000 ラジアン=180/pi角度 dis180/pi0.2/1000=往復運動の幅 往復周期=2pi*100/120=5.236s つまり、1パターンでは、12/5.236=2.2918周期で往復
座標範囲 x~(0,2560) y~(0,1440) 左上は(0,0) ```
手順:
(計測) 1. measurement.mを実行して、距離、被験者番号、試行数を入れる(数字を入れてからENTERを押す)ーーーー実験開始
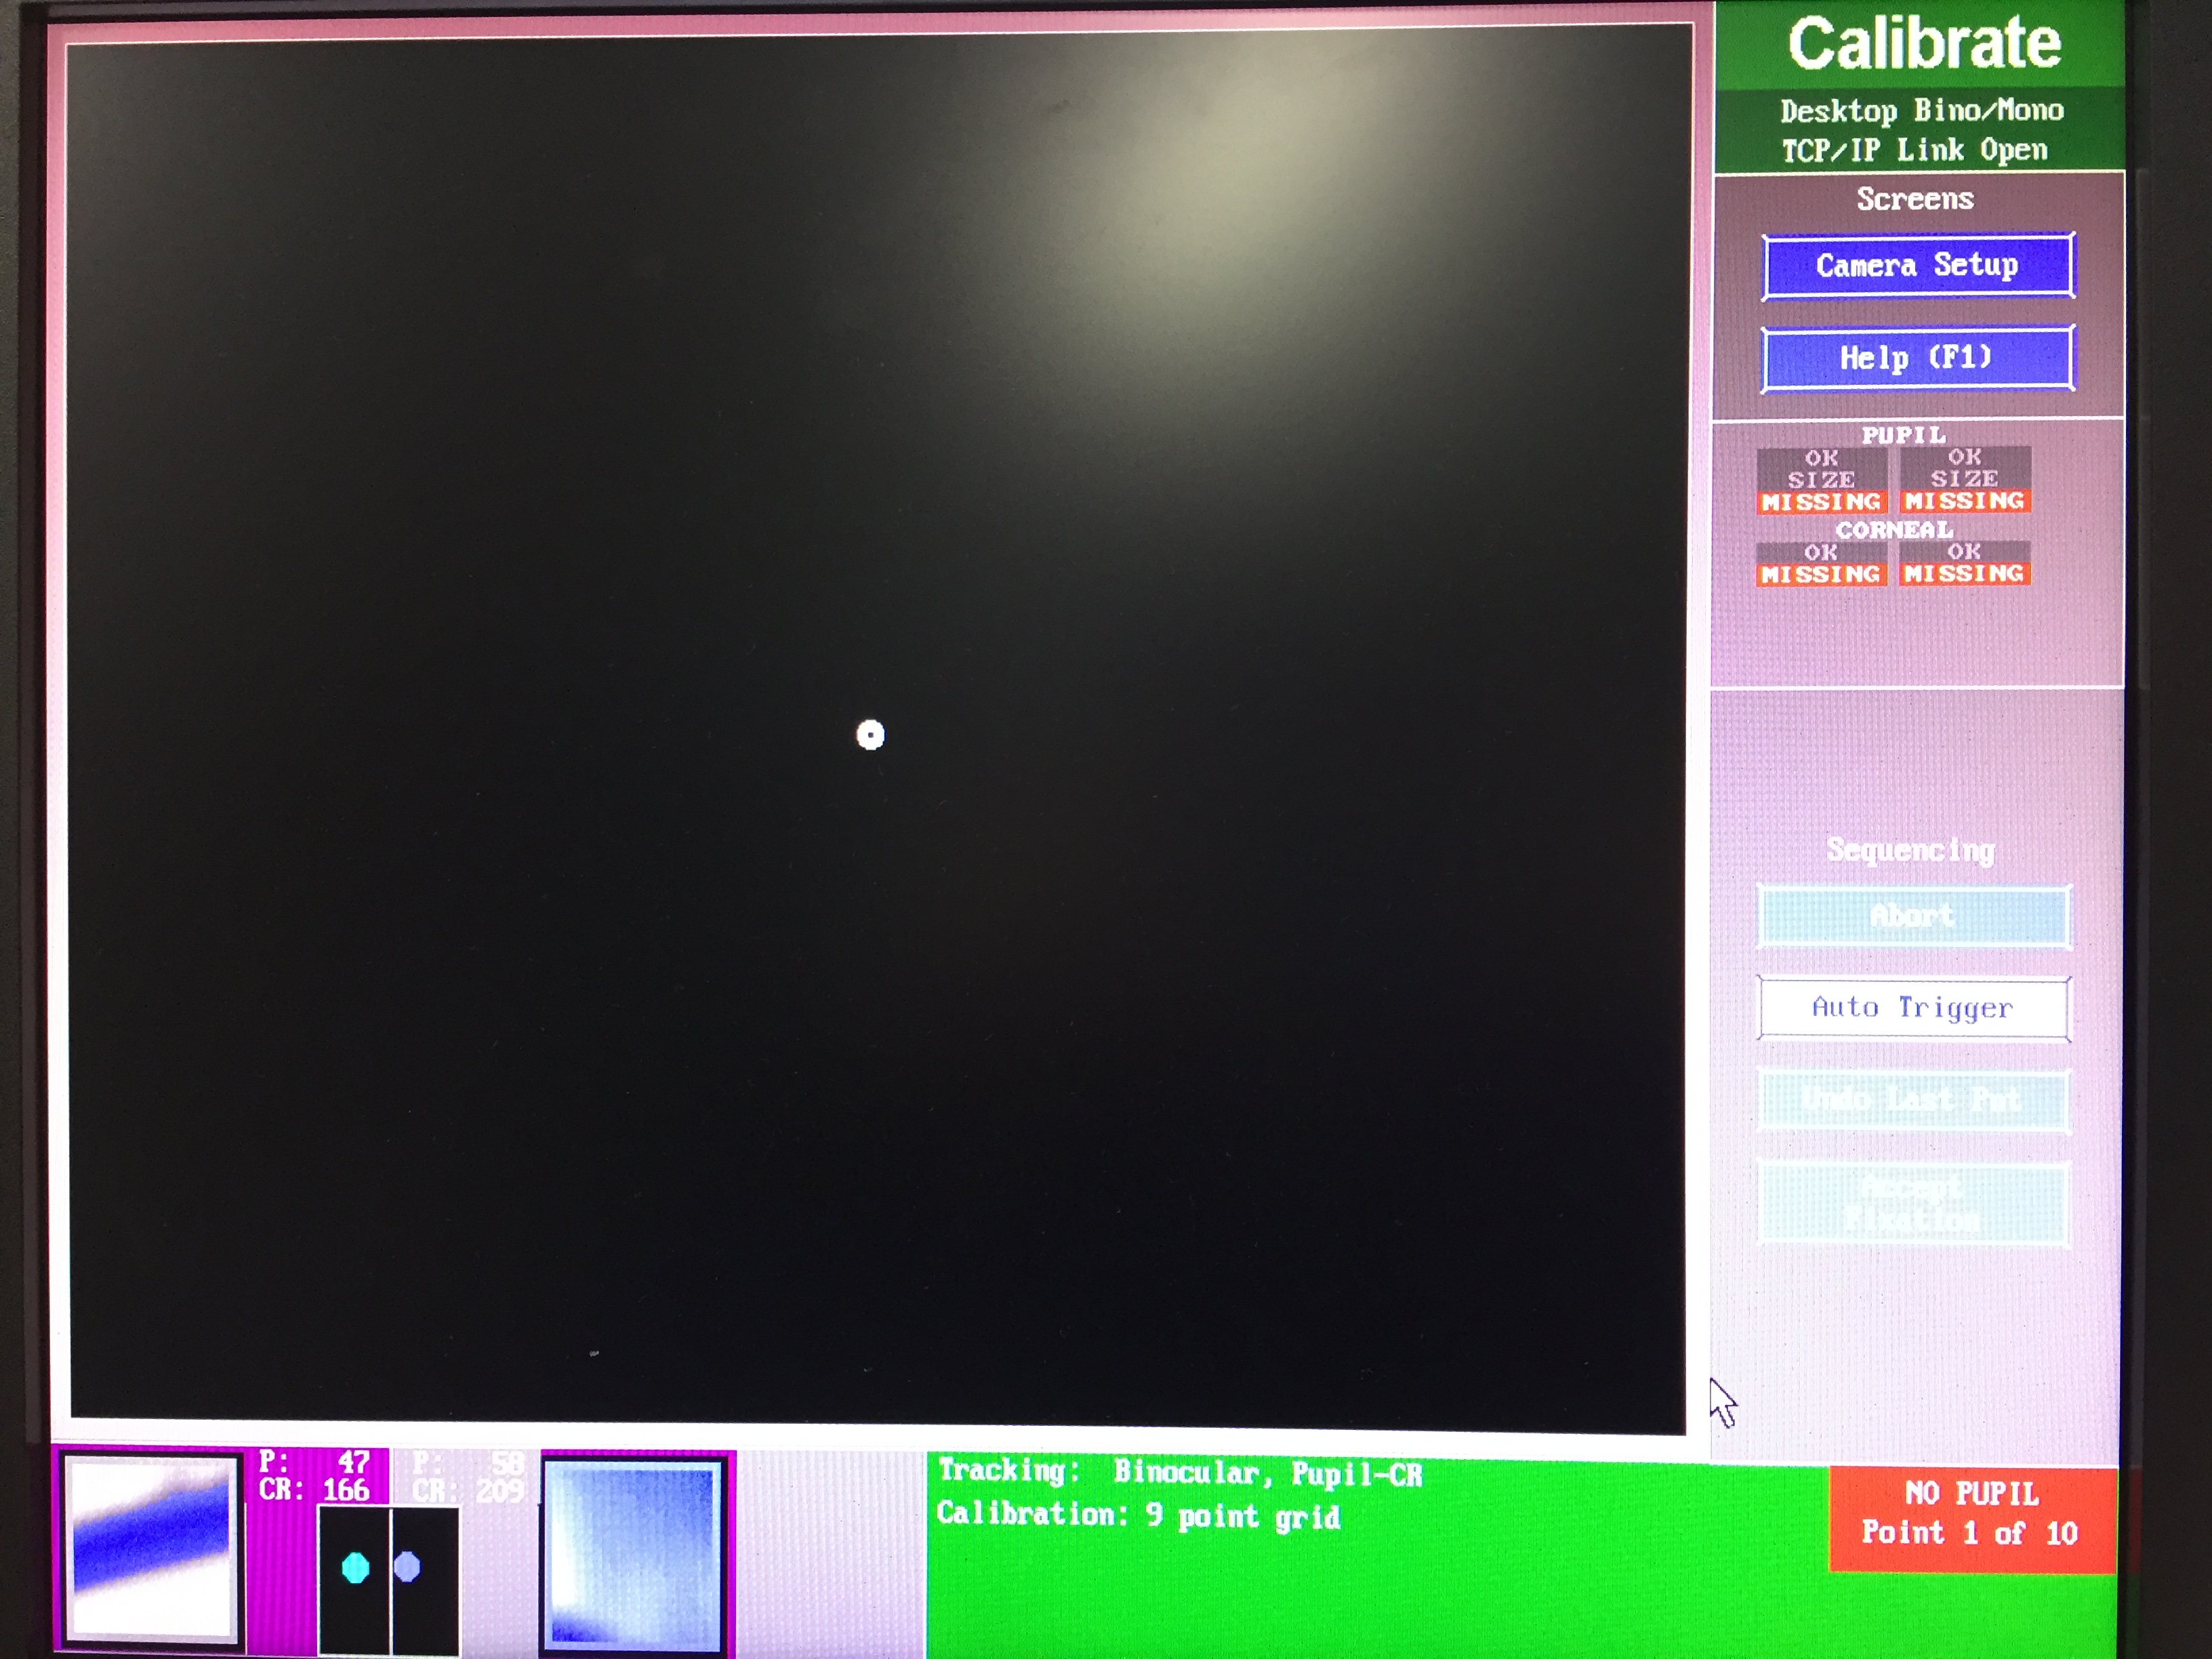
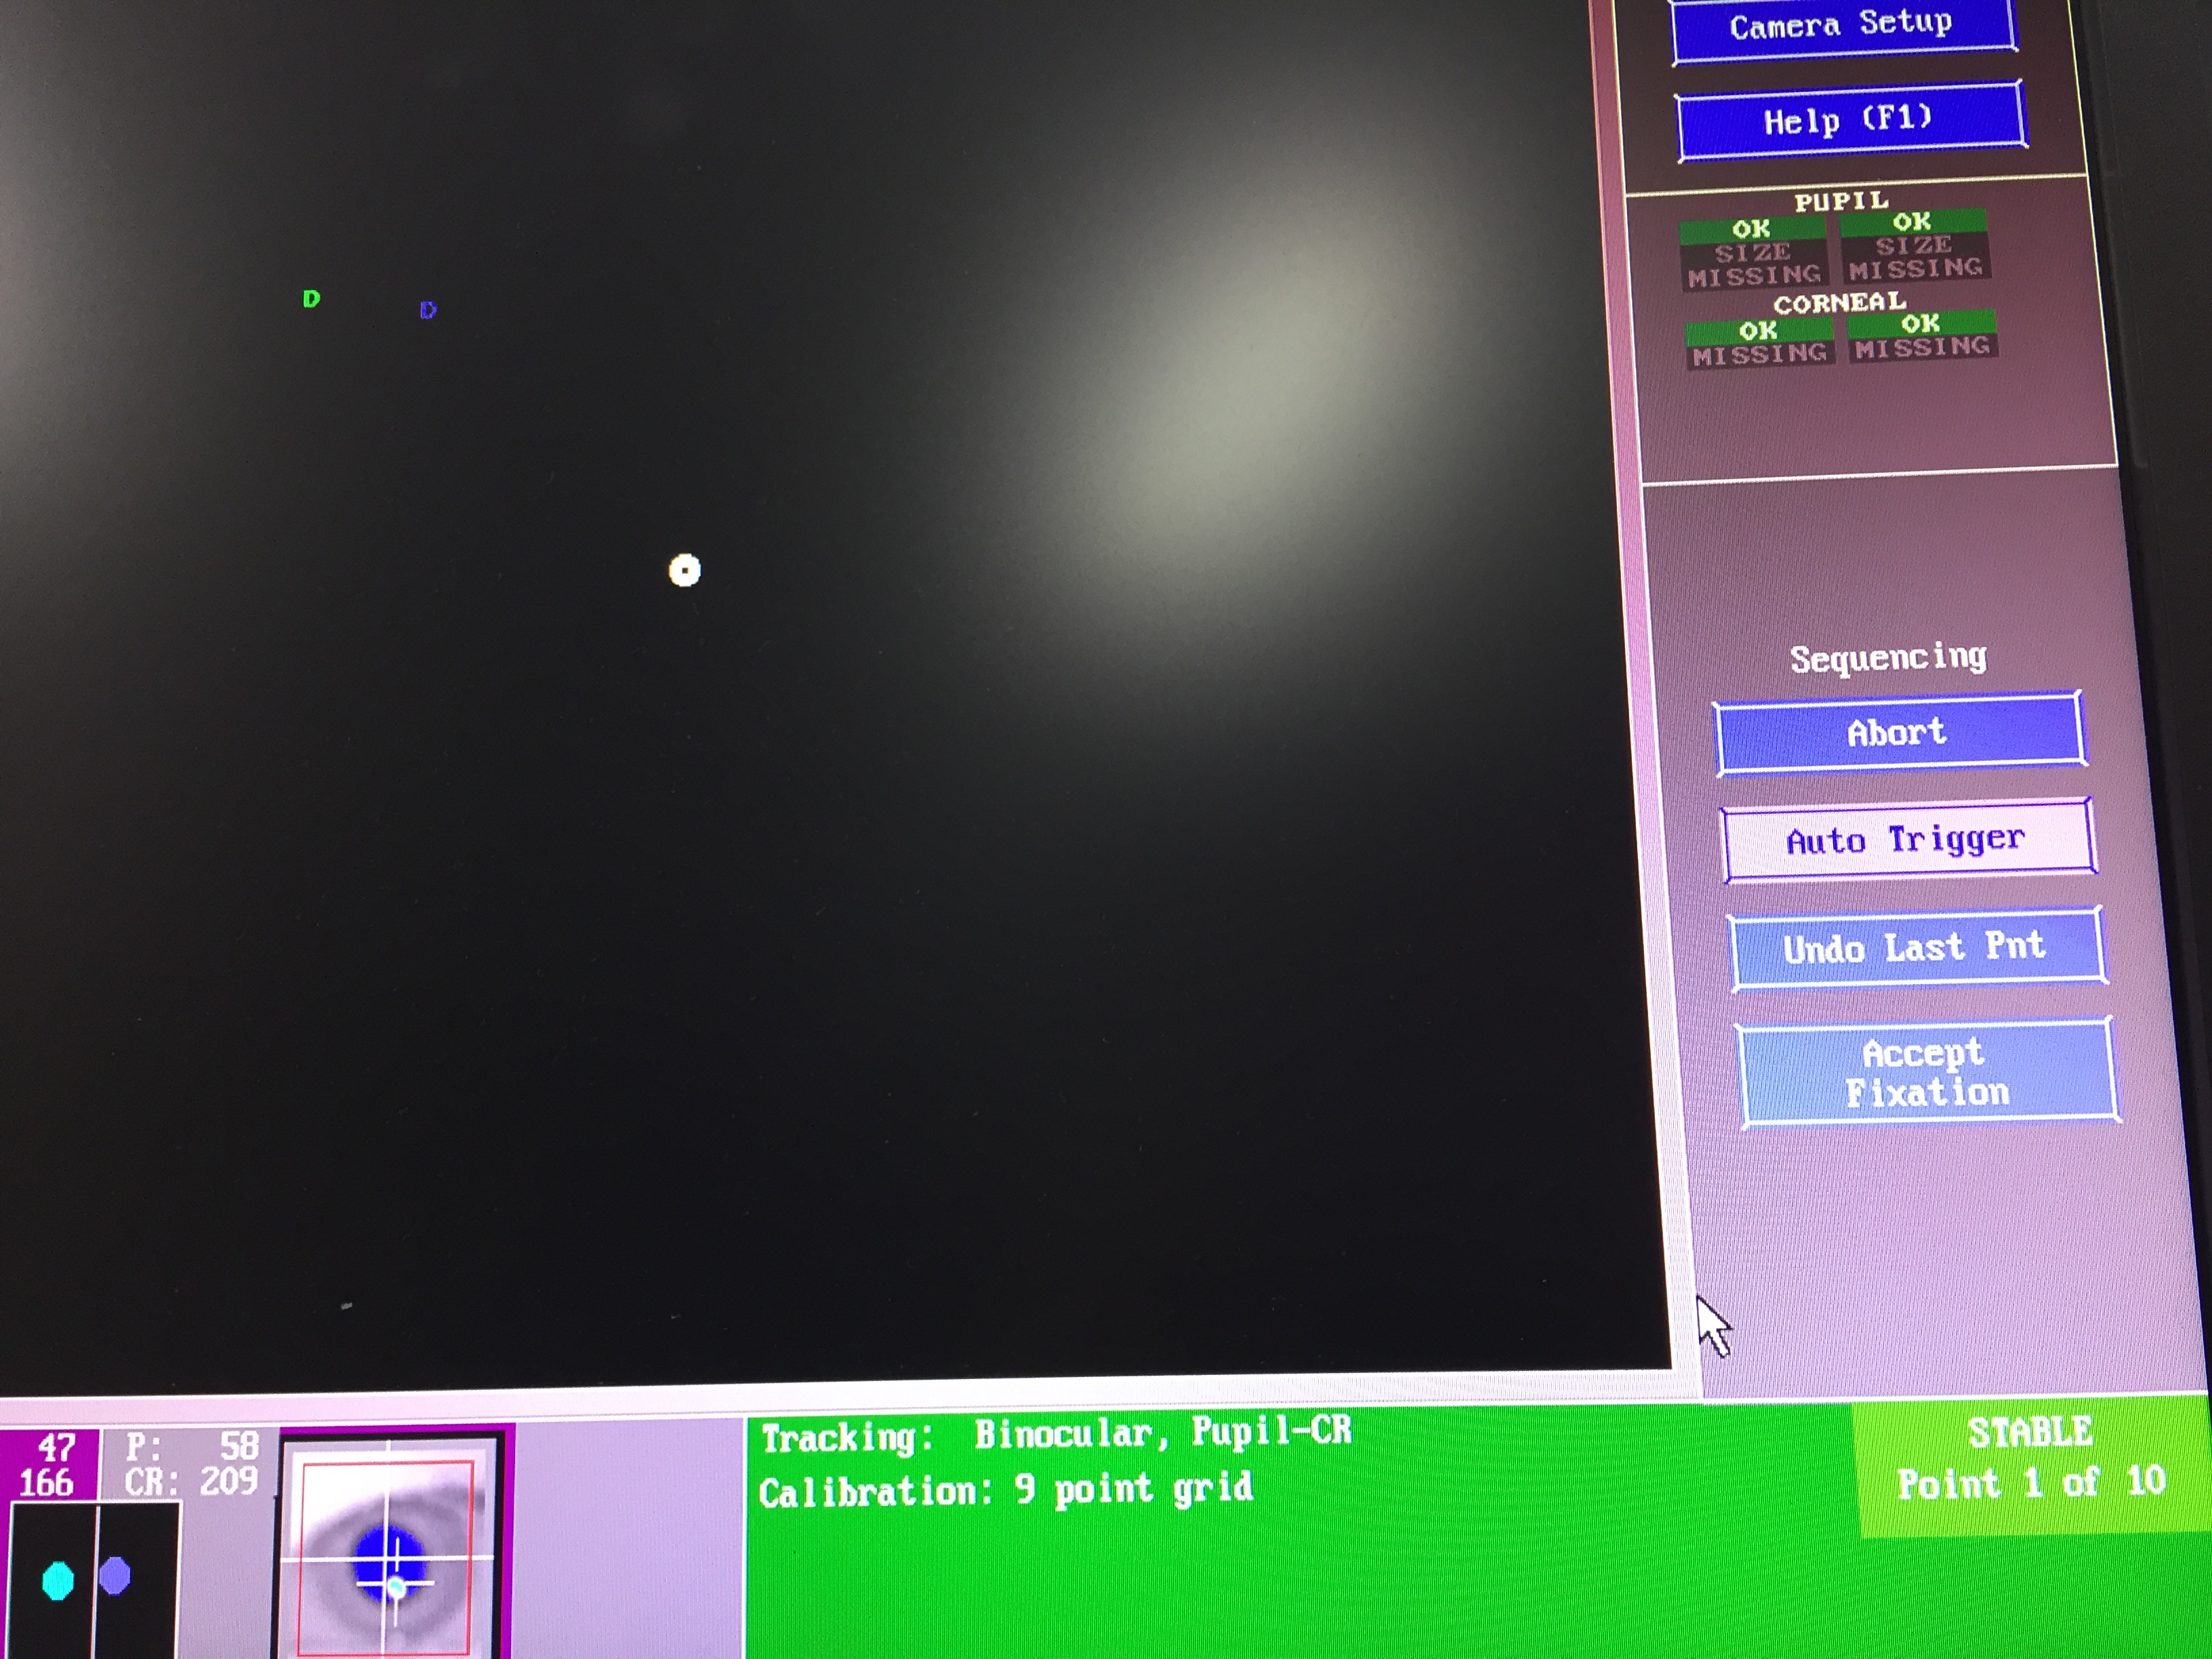
- キャリブレーション ‘C’を押してキャリブレーション画面に入る 右下の緑の’STABLE’が出てから’Auto Trigger’を2回押す(=’A’keyを押す)。終わったら’Accept’をクリックする PS:両目の安定を維持する PPS:たまに目はHostPCのscreenに遮断されるので、遮断されないように調整してください
3.validate: ‘V’を押してvalidate画面に入る 右下の緑の’STABLE’が出てから’Auto Trigger’を2回押す (=’A’keyを押す) 。終わったら’Accept’をクリックする 4.計測開始: ’output/record’を押して安定になたっら’space’を押す
stop: ’Esc’を押して刺激画面が出てきてもう一度 ‘Esc’を押す
実験が開始するなら、desktopには’demo_(被験者番号)_(試行数)’のようなファイルが作成される。たとえば、demo_1_3は被験者1、3回目のデータファイル
(計算)
- cal.mを実行して被験者番号、試行数を入れる(数字を入れてからENTERを押す)
- ワークススペースの中で、pattern 1~4をプロットする
参考資料 (04/17更新)
- Intro http://www.sbirc.ed.ac.uk/cyril/download/DTP_Intro_Psychtoolbox_3.pdf
- Tutorial http://cda.psych.uiuc.edu/matlab_class/Psychtoolbox%20-%20Tutorial.htm
- Cookbook https://github.com/Psychtoolbox-3/Psychtoolbox-3/wiki/Cookbook:-Seitz-Tutorial-Experiments
- function test platform http://52brain.com/thread-25330-1-1.html
- ptb入門 http://www2.kaiyodai.ac.jp/~tkusan0/talk/pdf/vsj2013.pdf (利用可能なプログラム入り)
- 貴重な情報源 https://sites.google.com/site/ptbganba/
- パターン刺激1 https://sites.google.com/site/ptbganba/ptbpuroguramingu-tips/patan-shigeki
- パターン刺激2(ランダム) https://sites.google.com/site/ptbganba/ptbpuroguramingu-tips/patan-shigeki-2-randamu
- オフスクリーンウィンドウ( 描画速度 ) https://sites.google.com/site/ptbganba/ptbpuroguramingu-tips/ofusukurin-u-indou
- 両眼分離 https://sites.google.com/site/ptbganba/ptbno-komando-no-setsumei/miao-hua-guan-xi/screen-openwindow
- 両眼分離 https://github.com/Psychtoolbox-3/Psychtoolbox-3/blob/master/Psychtoolbox/PsychDemos/ImagingStereoDemo.m
- ランダムドット https://sites.google.com/site/ptbganba/ptbpuroguramingu-tips/randamudottosutereoguramu
- 中文学习 十字 https://zhouyl.wordpress.com/2016/06/11/psychtoolbox%E5%AD%A6%E4%B9%A0/
- psychtoolbox eyelink http://docs.psychtoolbox.org/Eyelink
- eyelink README file:///C:/Users/Public/Documents/EyeLink/SampleExperiments/MATLAB%20Psychtoolbox/readme.html
- http://real.psych.ubc.ca/index.php/Eyelink_1000_Eye-Tracking_System
- eyelink command https://www.psychologie.uni-heidelberg.de/ae/allg_en/forschun/EyelinkToolbox.pdf
- eyelink guide http://human.cbtc.utoronto.ca/tutorials/eyelink/EyeLink_Programmer_Guide.pdf
- Eyelink installation guide http://pages.uoregon.edu/prd/Eyelink/EyeLink%201000%20Installation%20Guide%201.3.0.pdf
- edf fileの導入 http://52brain.com/thread-149067-1-1.html
- edf file https://jp.mathworks.com/matlabcentral/fileexchange/31900-edfread
- edf to txt http://sr-research.jp/support/2014/06/edf2asc.html
- edf2matlab struct https://github.com/uzh/edf-converter
- eyelink 1000 user manual P28 P92 http://sr-research.jp/support/EyeLink%201000%20User%20Manual%201.5.0.pdf
- windows tensorflow https://zhuanlan.zhihu.com/p/24055668
- https://efeiefei.gitbooks.io/tensorflow_documents_zh/install/install_windows.html
- https://zhuanlan.zhihu.com/p/25911646
- MNIST http://www.csuldw.com/2016/02/25/2016-02-25-machine-learning-MNIST-dataset/
- MNIST https://deeplearning4j.org/cn/mnist-for-beginners
- http://wiki.jikexueyuan.com/project/tensorflow-zh/tutorials/mnist_beginners.html
- TF jiaocheng https://morvanzhou.github.io/tutorials/machine-learning/tensorflow/
- TF MNIST https://blog.csdn.net/wspba/article/details/54097760
- MNIST 数据详解 https://blog.csdn.net/qq_36686996/article/details/79363283
- 手動認識 https://blog.csdn.net/Sparta_117/article/details/66965760